Attendee engagement
See how deeply attendees used the event app, who your most active attendees are, and the industries, roles and seniority of your audience.
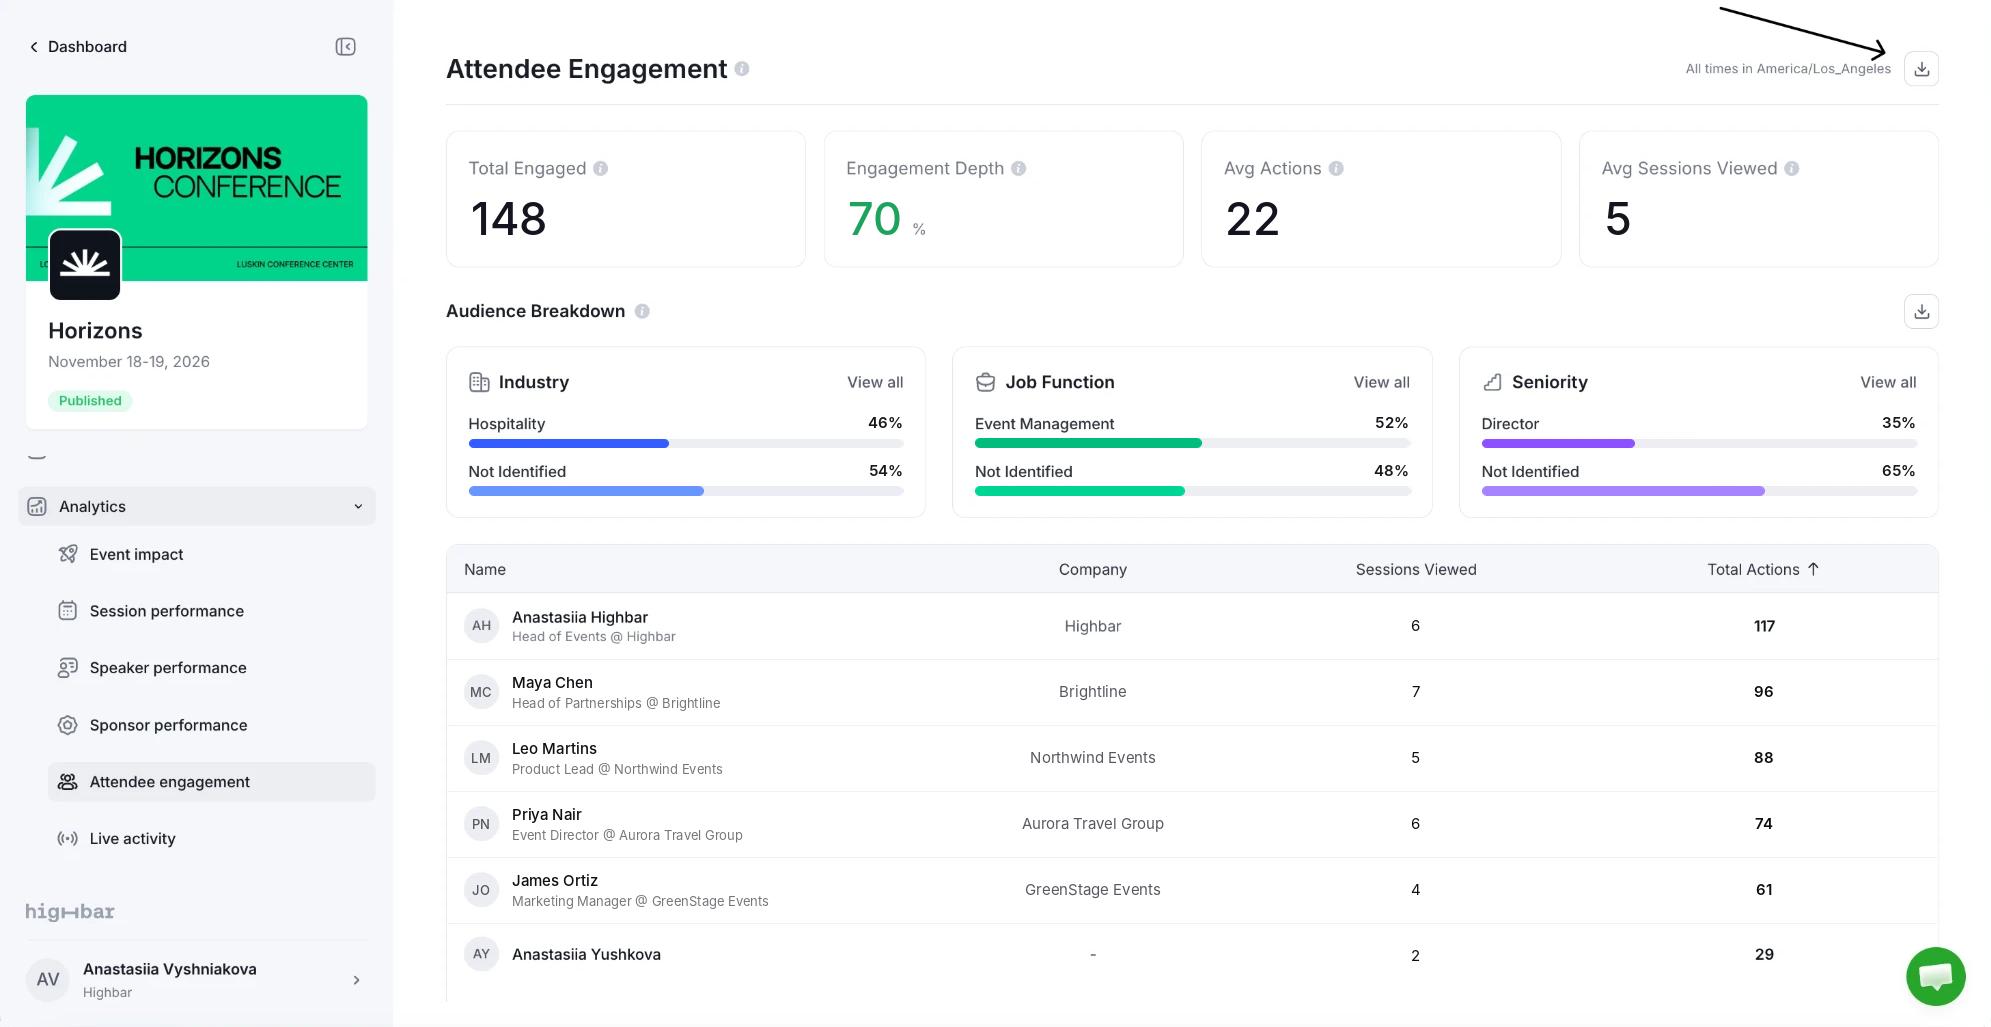
Attendee engagement shows how much attendees used the app, who used it most, and who your audience is.
You'll find Attendee engagement in the event sidebar after launch, under Analytics. All numbers cover the whole event so far. Times are in your event's time zone.
The numbers at the top
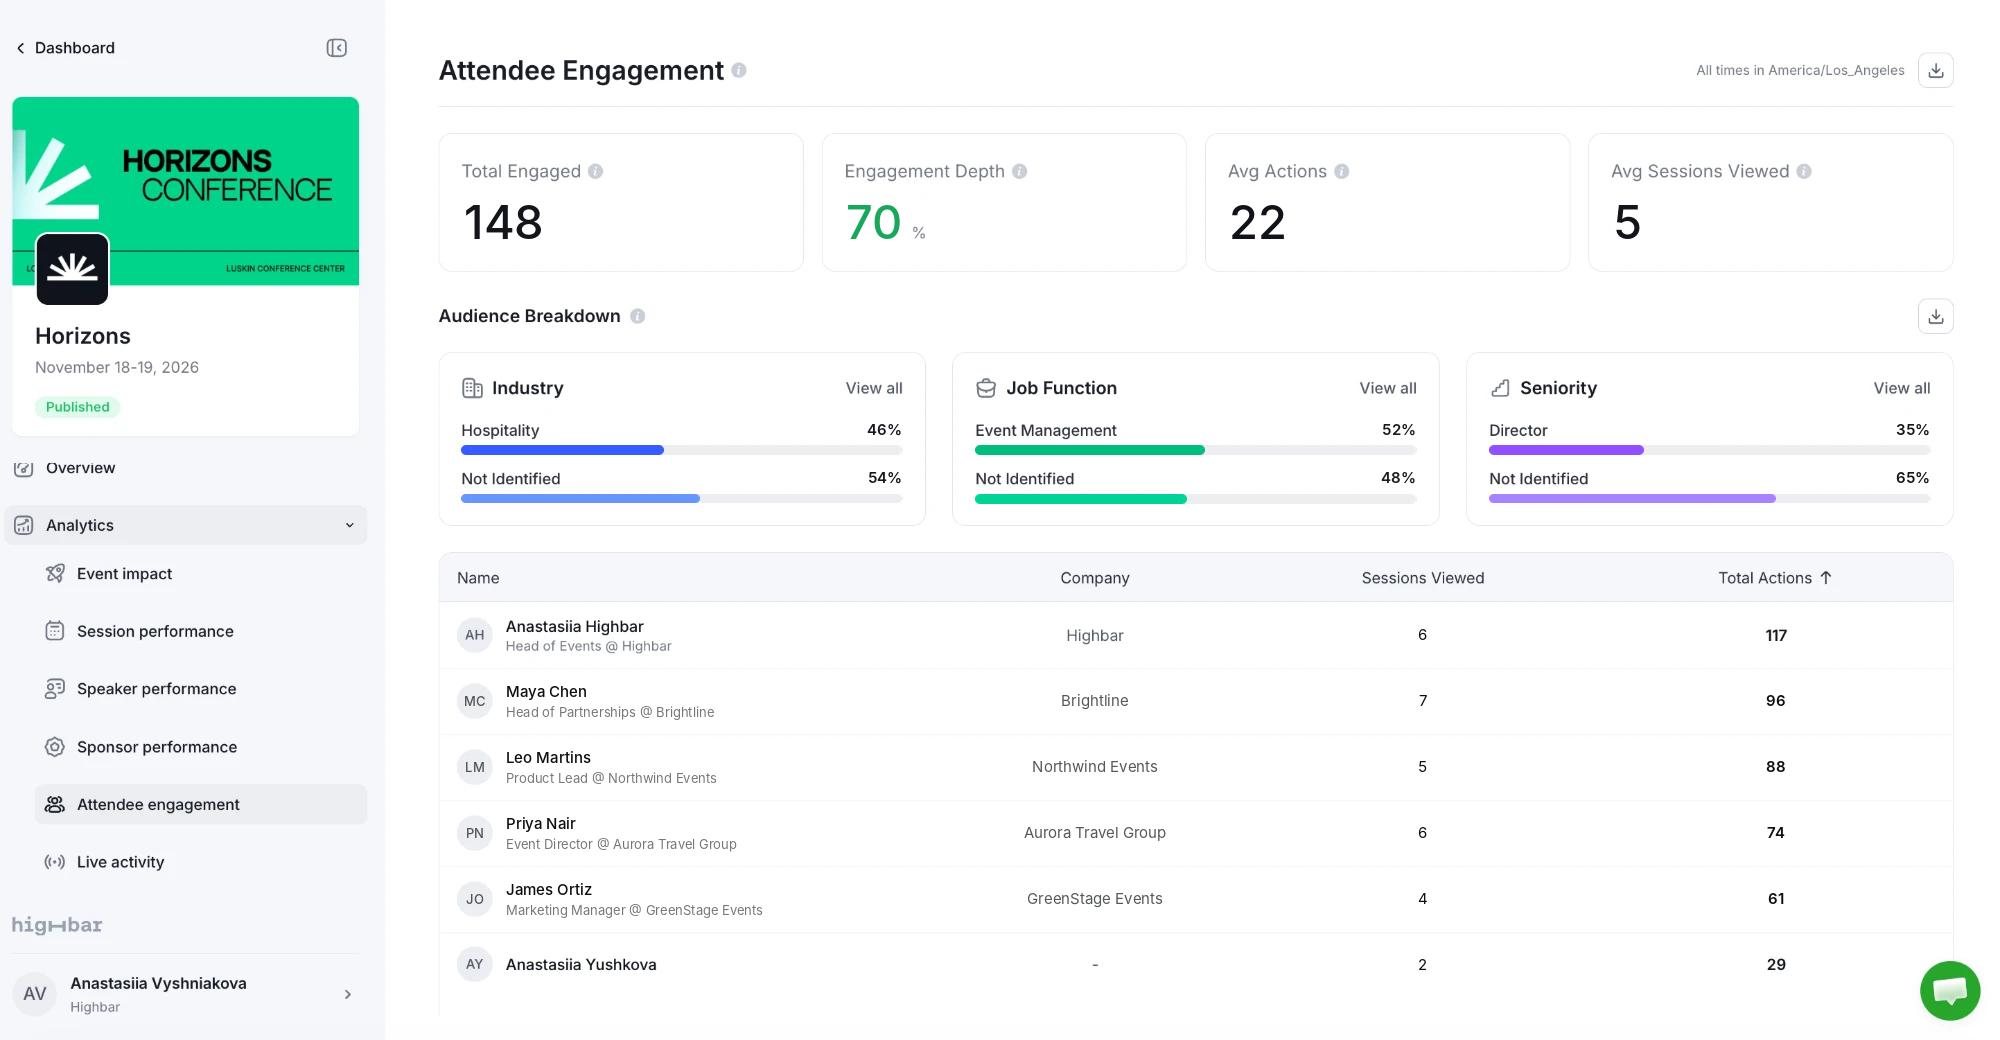
| Card | What it shows |
|---|---|
| Total Engaged | Attendees who used the app repeatedly or over time. The same number as Highly Engaged elsewhere. |
| Engagement Depth | The share of app users who are engaged. The same as Attendee Health on other pages, rounded to a whole number. |
| Avg Actions | Actions per engaged attendee, on average. |
| Avg Sessions Viewed | Session opens per engaged attendee, on average. |
How engagement is measured explains when an attendee counts as engaged.
Audience breakdown
Audience Breakdown sorts your attendees by Industry, Job Function and Seniority, using AI to read their profiles. Each card shows the top five groups and Other. Click View all for every group. Attendees whose profile doesn't say are counted as Not identified.
The breakdown runs by itself when you open the page, and refreshes at most once an hour.
Your most engaged attendees
The table lists every engaged attendee with their Company, Sessions Viewed and Total Actions, most active first. Click any column to sort.
Click an attendee to see what they did: page views, sessions, bookmarks, sponsor and speaker activity, networking, meetings and ratings, hour by hour and as a list of their latest actions.
Download
Click the download button at the top right to export every engaged attendee as a CSV, with their name, company, position, sessions viewed and total actions. The Audience Breakdown has its own download button.