Session performance
See how attendees engaged with each session, with views, reach, bookmarks, ratings and registrations, and download the results.
Session performance shows how attendees engaged with every session and subsession in your schedule. Use it to see which sessions drew interest, which were rated well, and which filled up.
You'll find Session performance in the event sidebar after launch, under Analytics. All numbers cover the whole event so far and can be up to a minute behind. Times are in your event's time zone.
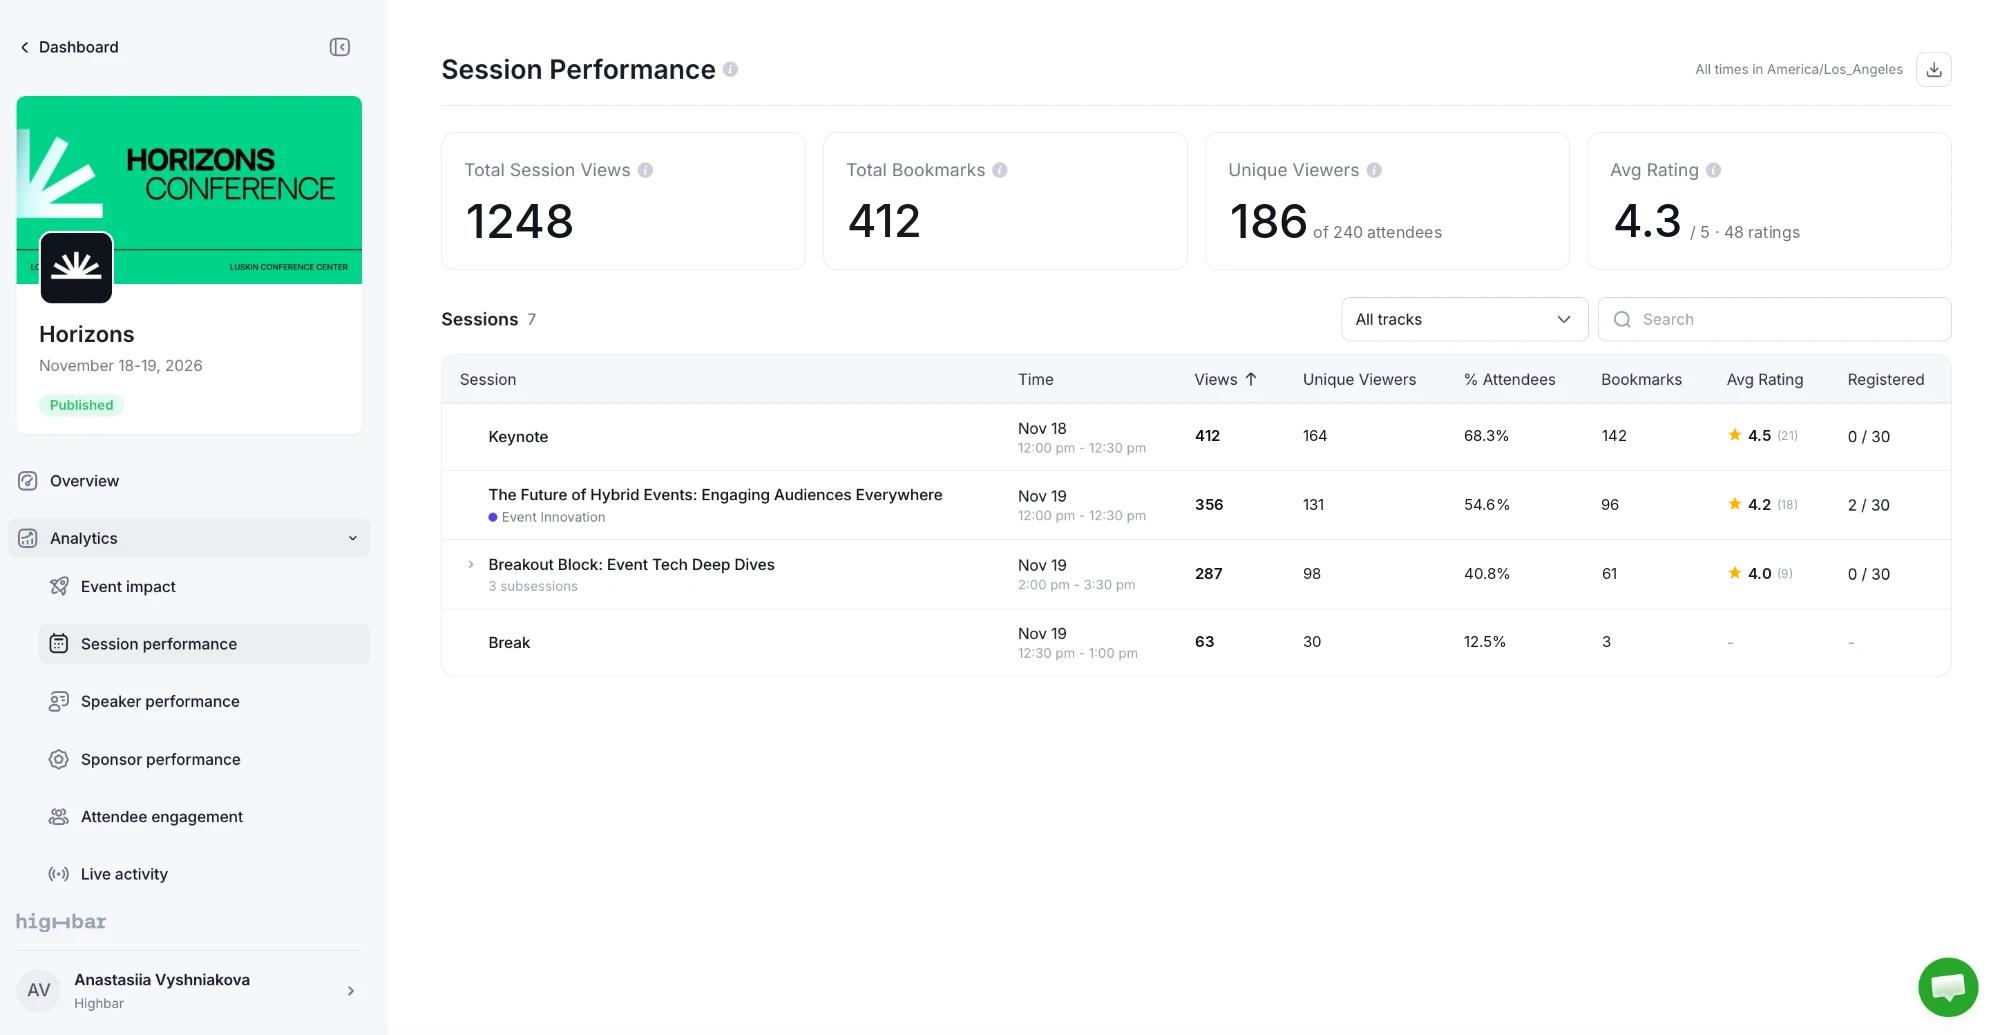
The numbers at the top
| Card | What it shows |
|---|---|
| Total Session Views | Times attendees opened a session's details. Every open counts. |
| Total Bookmarks | Times attendees added a session to their schedule. |
| Unique Viewers | Attendees who opened at least one session, each counted once, out of everyone on your attendee list. |
| Avg Rating | The average star rating attendees gave, out of 5. Shown when at least one session can be rated. |
Your own previews in the CMS are left out, so averages can differ slightly from what you see in the app.
The sessions table
| Column | What it shows |
|---|---|
| Views | Times the session was opened. |
| Unique Viewers | Attendees who opened it, each counted once. |
| % Attendees | Unique viewers as a share of everyone on your attendee list. |
| Bookmarks | Times attendees added it to their schedule. |
| Avg Rating | The average rating and how many ratings, such as 4.3 (12). Off means ratings are turned off for the session; - means nobody has rated it yet. |
| Registered | For sessions that take registrations: confirmed sign-ups out of the capacity, and how many are waitlisted. |
A session with subsessions shows totals for itself and its subsessions. Click the arrow to see each subsession on its own. Its rating is always the session's own.
Search by title or track, filter by track, and click any column to sort. The table opens sorted by Views.
Registered here means people signed up for that session. It's different from the "registered attendees" in How engagement is measured, which means everyone on your attendee list.
Look at one session
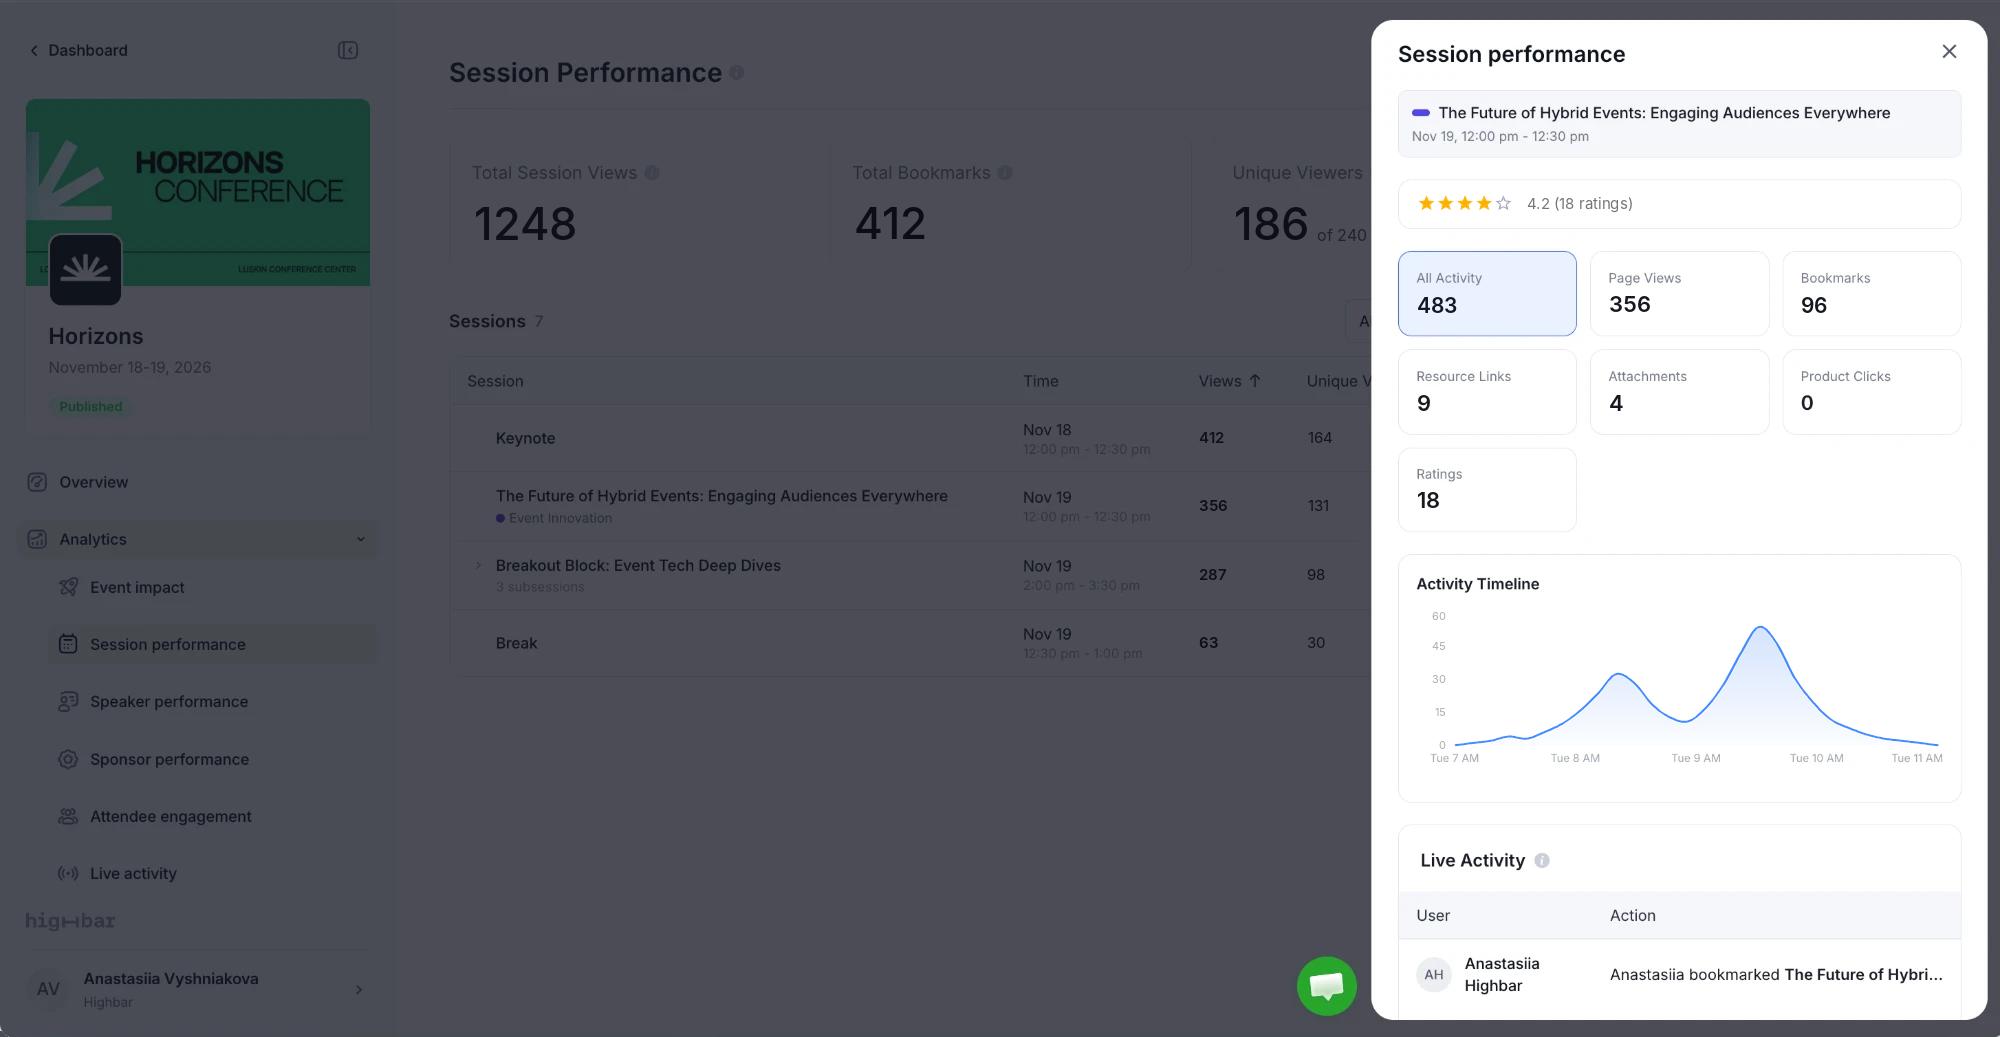
Click a session to open its details:
- Its rating. Click it to see every rating, with comments and, if speakers are rated too, each speaker's rating.
- Cards for Page Views, Bookmarks, Resource Links, Attachments, Product Clicks and Ratings. Click one to filter the chart and feed below.
- Activity Timeline: activity per hour.
- Live Activity: the latest actions attendees took on the session.
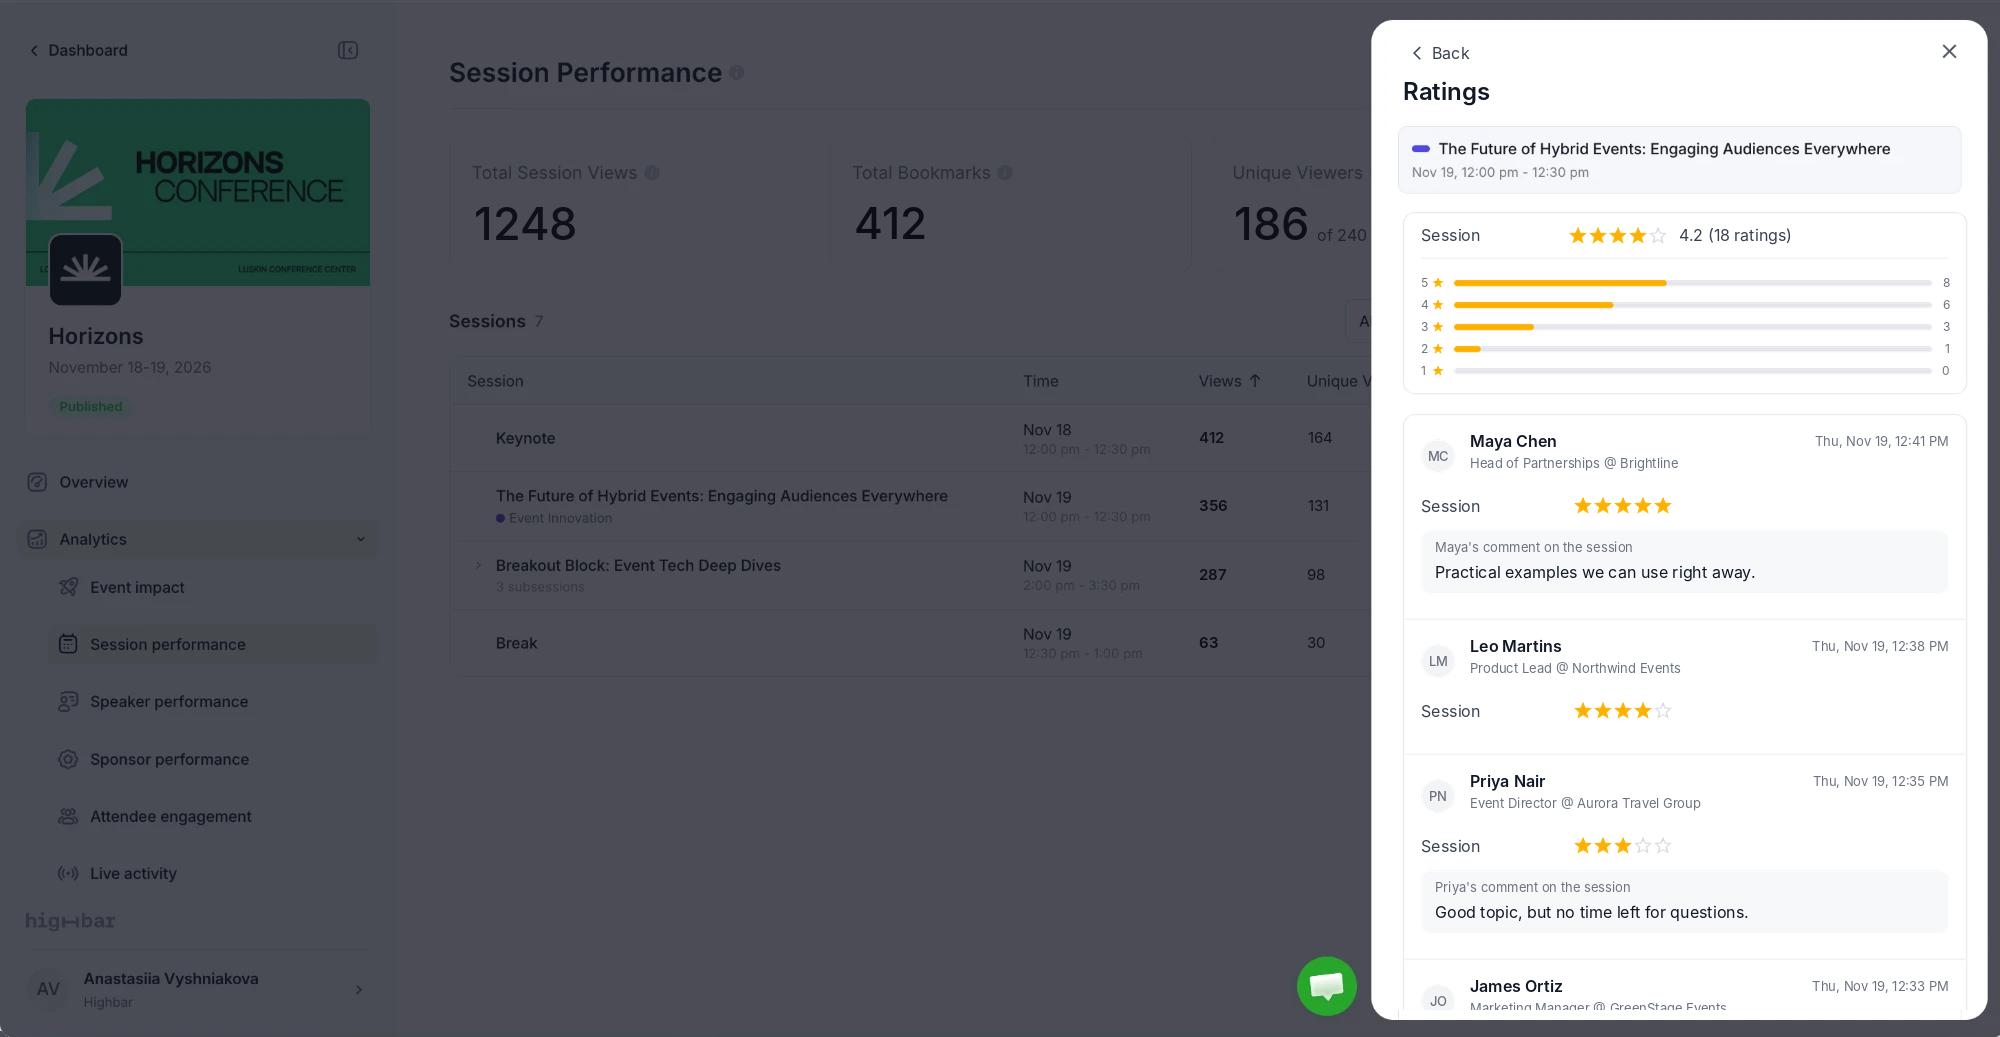
Click the rating to open Ratings: how many attendees gave each number of stars, then every rating with who gave it, when, and any comment. If speakers are rated too, each speaker's average and stars appear alongside. Click Back to return.
Download
Click the download button at the top right:
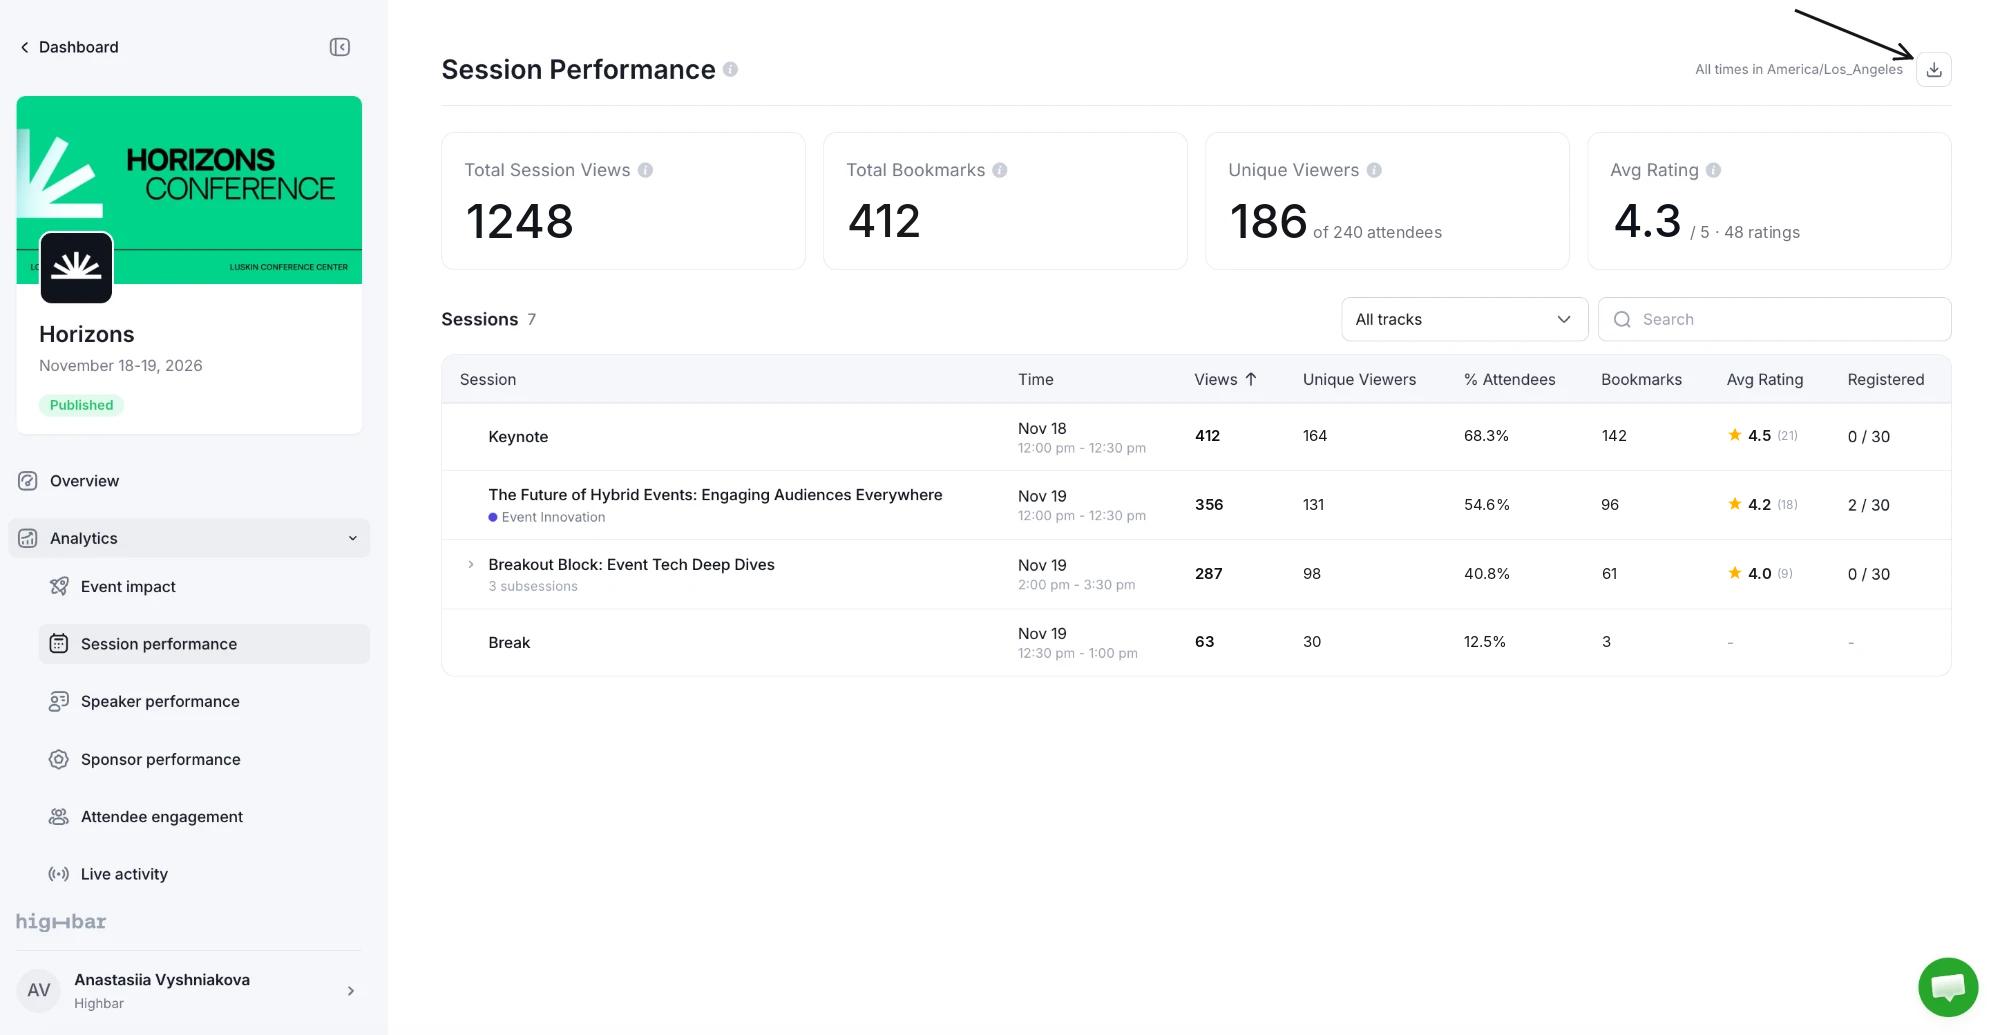
- Sessions downloads the table as a CSV, including every subsession. If you've searched or filtered, you get Sessions (filtered) instead.
- Ratings and comments downloads every rating for the whole event, with the attendee, their comment and any speaker ratings. It ignores your filters.
Downloads hold up to 25,000 rows.