Event impact
Your whole-event dashboard, with adoption, engagement, health scores, funnels, top sessions, speakers and sponsors, searches and devices, and a full export.
Event impact is your event's main analytics dashboard. It shows how many people got into the app and kept using it, which features and content they used, and how your sponsors did. Use it for a quick read during the event and for your post-event report.
You'll find Event impact in the event sidebar after launch, under Analytics. The page is headed Analytics. Numbers can be up to a minute behind: reload the page for the latest. Times are in your event's time zone.
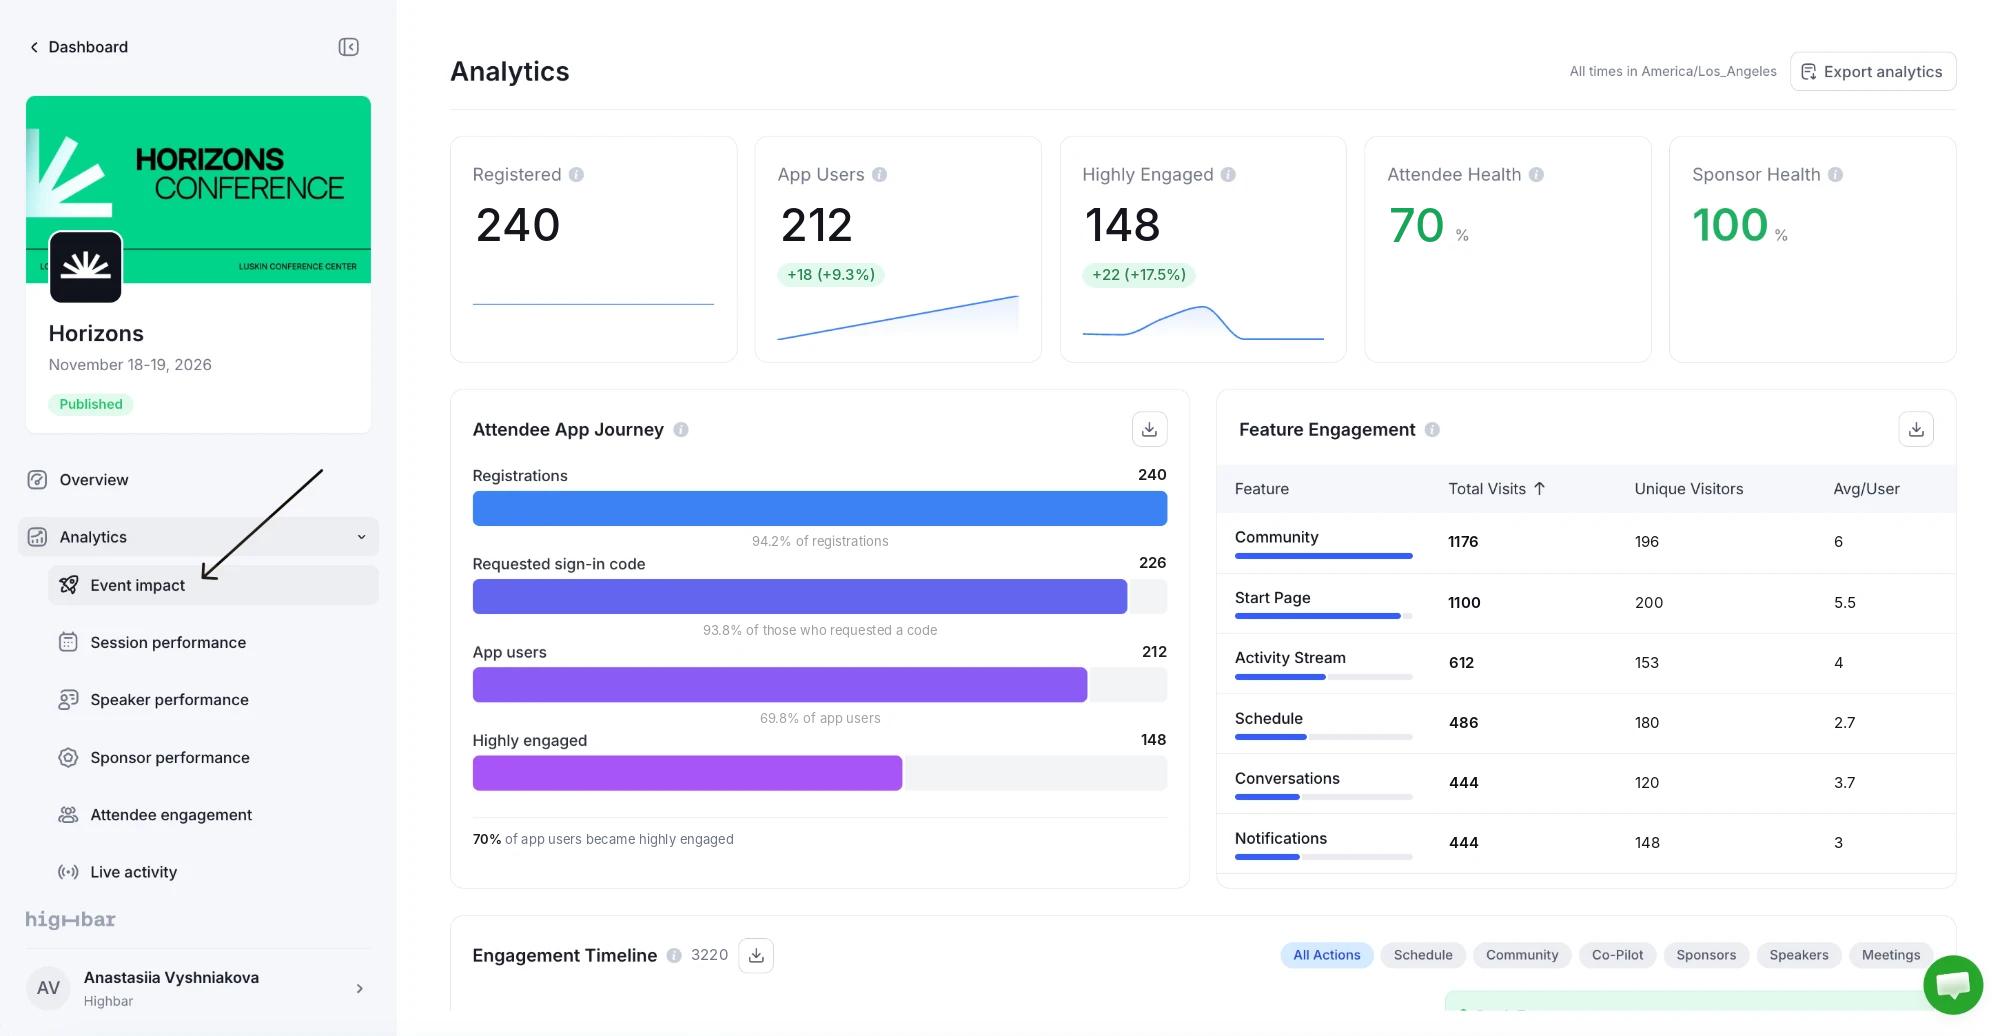
The numbers at the top
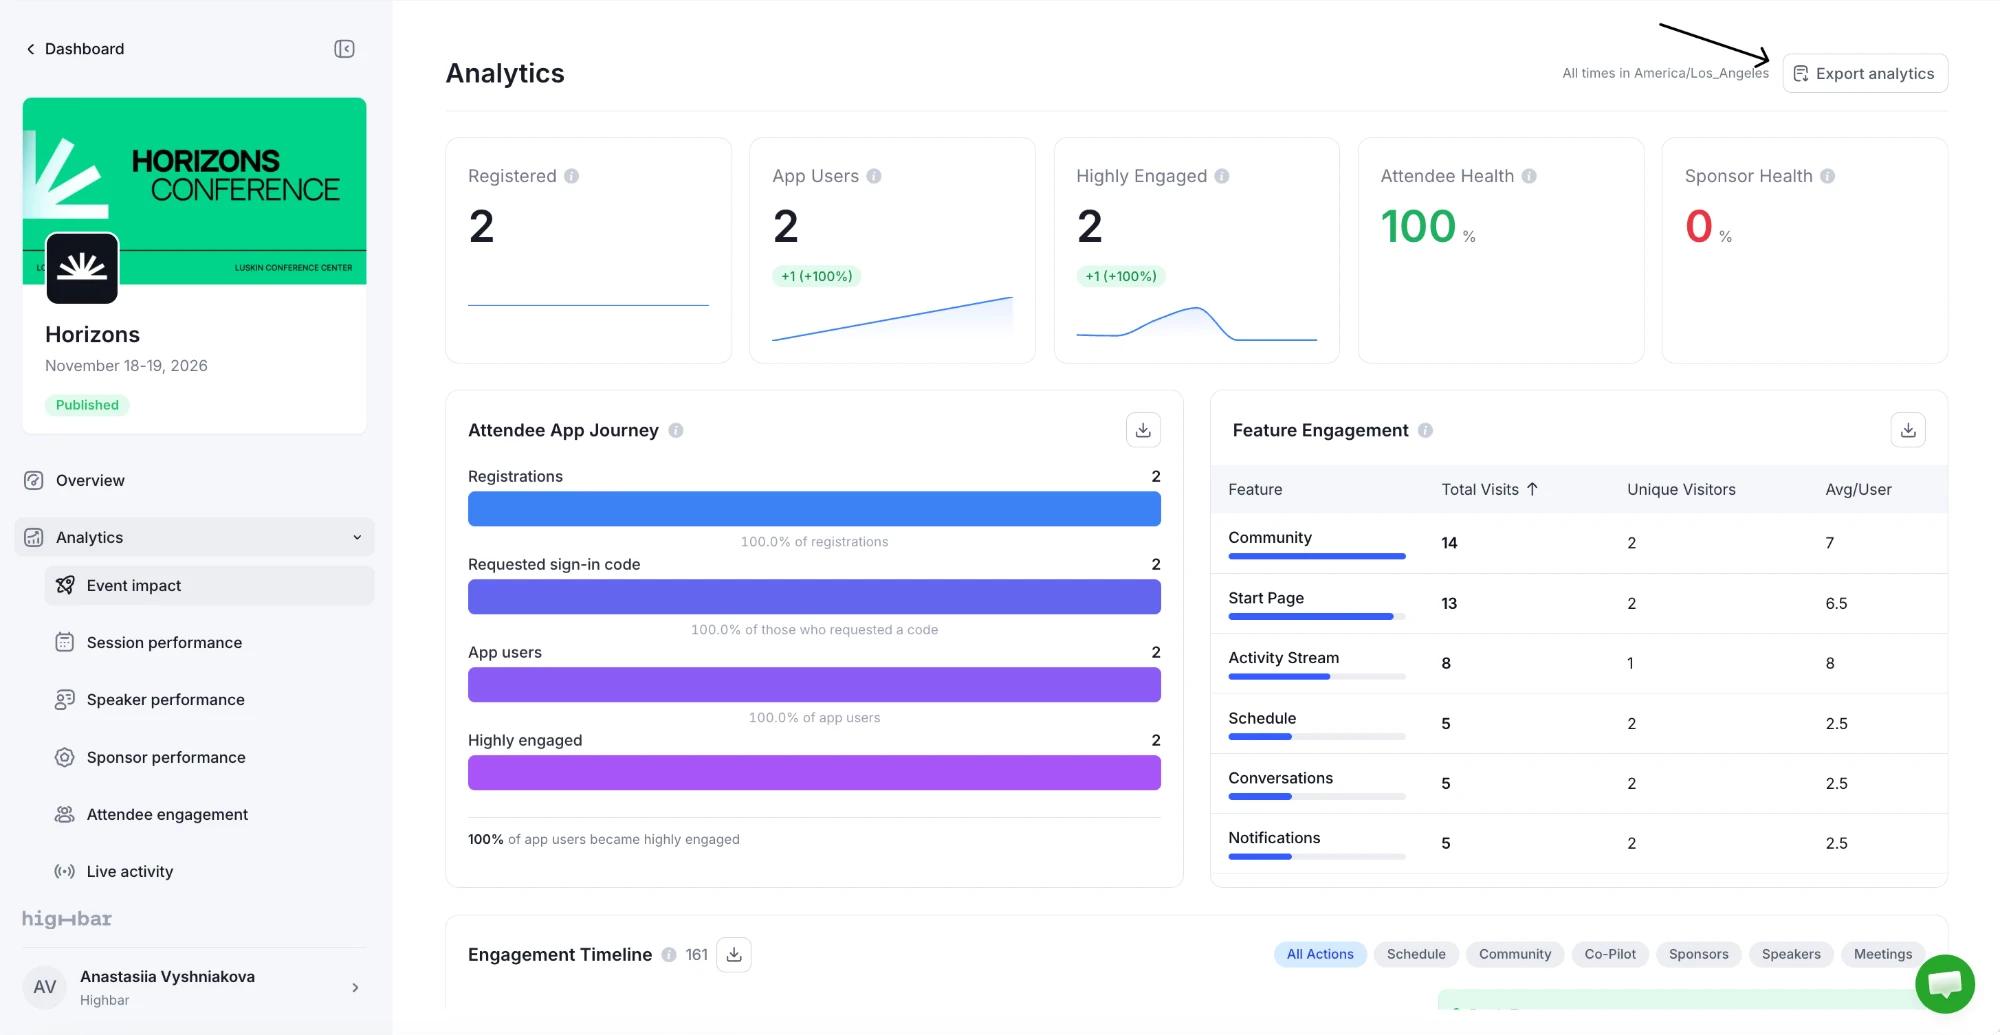
Registered, App Users and Highly Engaged count everyone on your list, everyone who got into the app, and everyone who used it repeatedly. Attendee Health and Sponsor Health are percentages: green from 70%, yellow from 40%, red below. How engagement is measured explains each one.
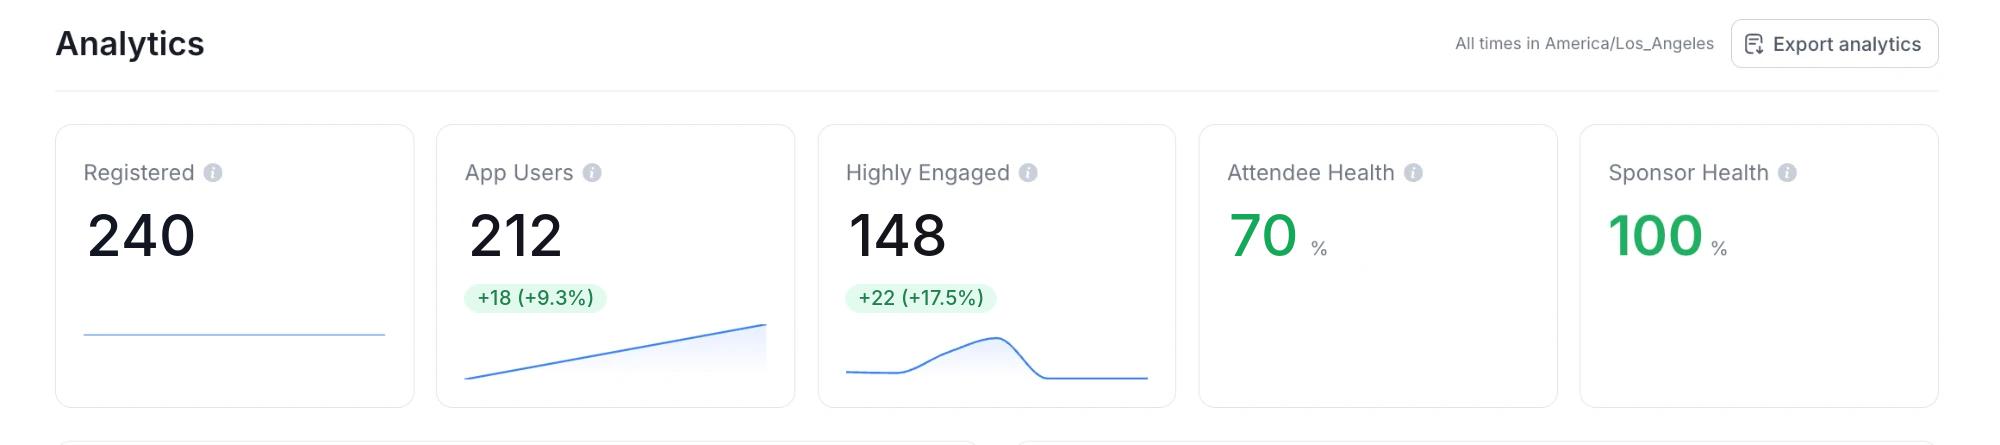
The small badge on a card shows the change over the last 24 hours, and the line under it shows the last 24 hours hour by hour.
Sections
| Section | What it shows |
|---|---|
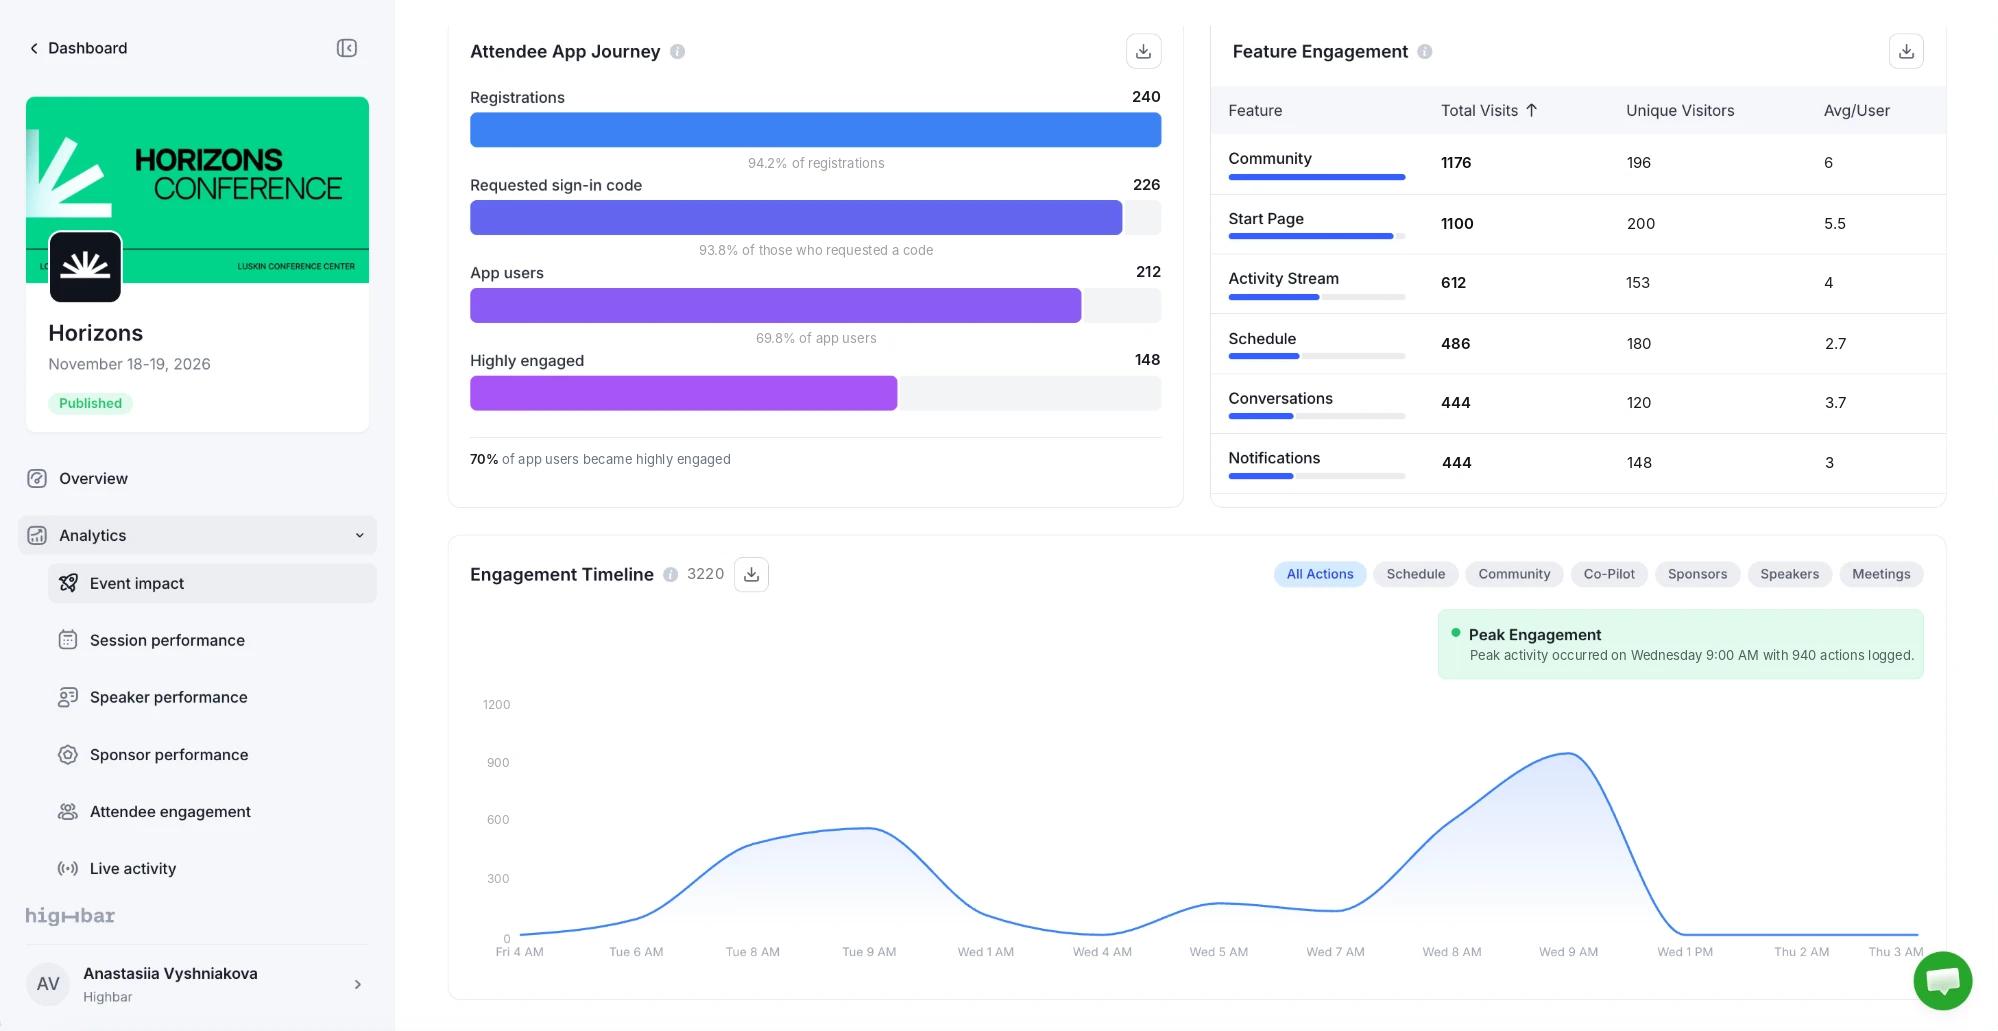
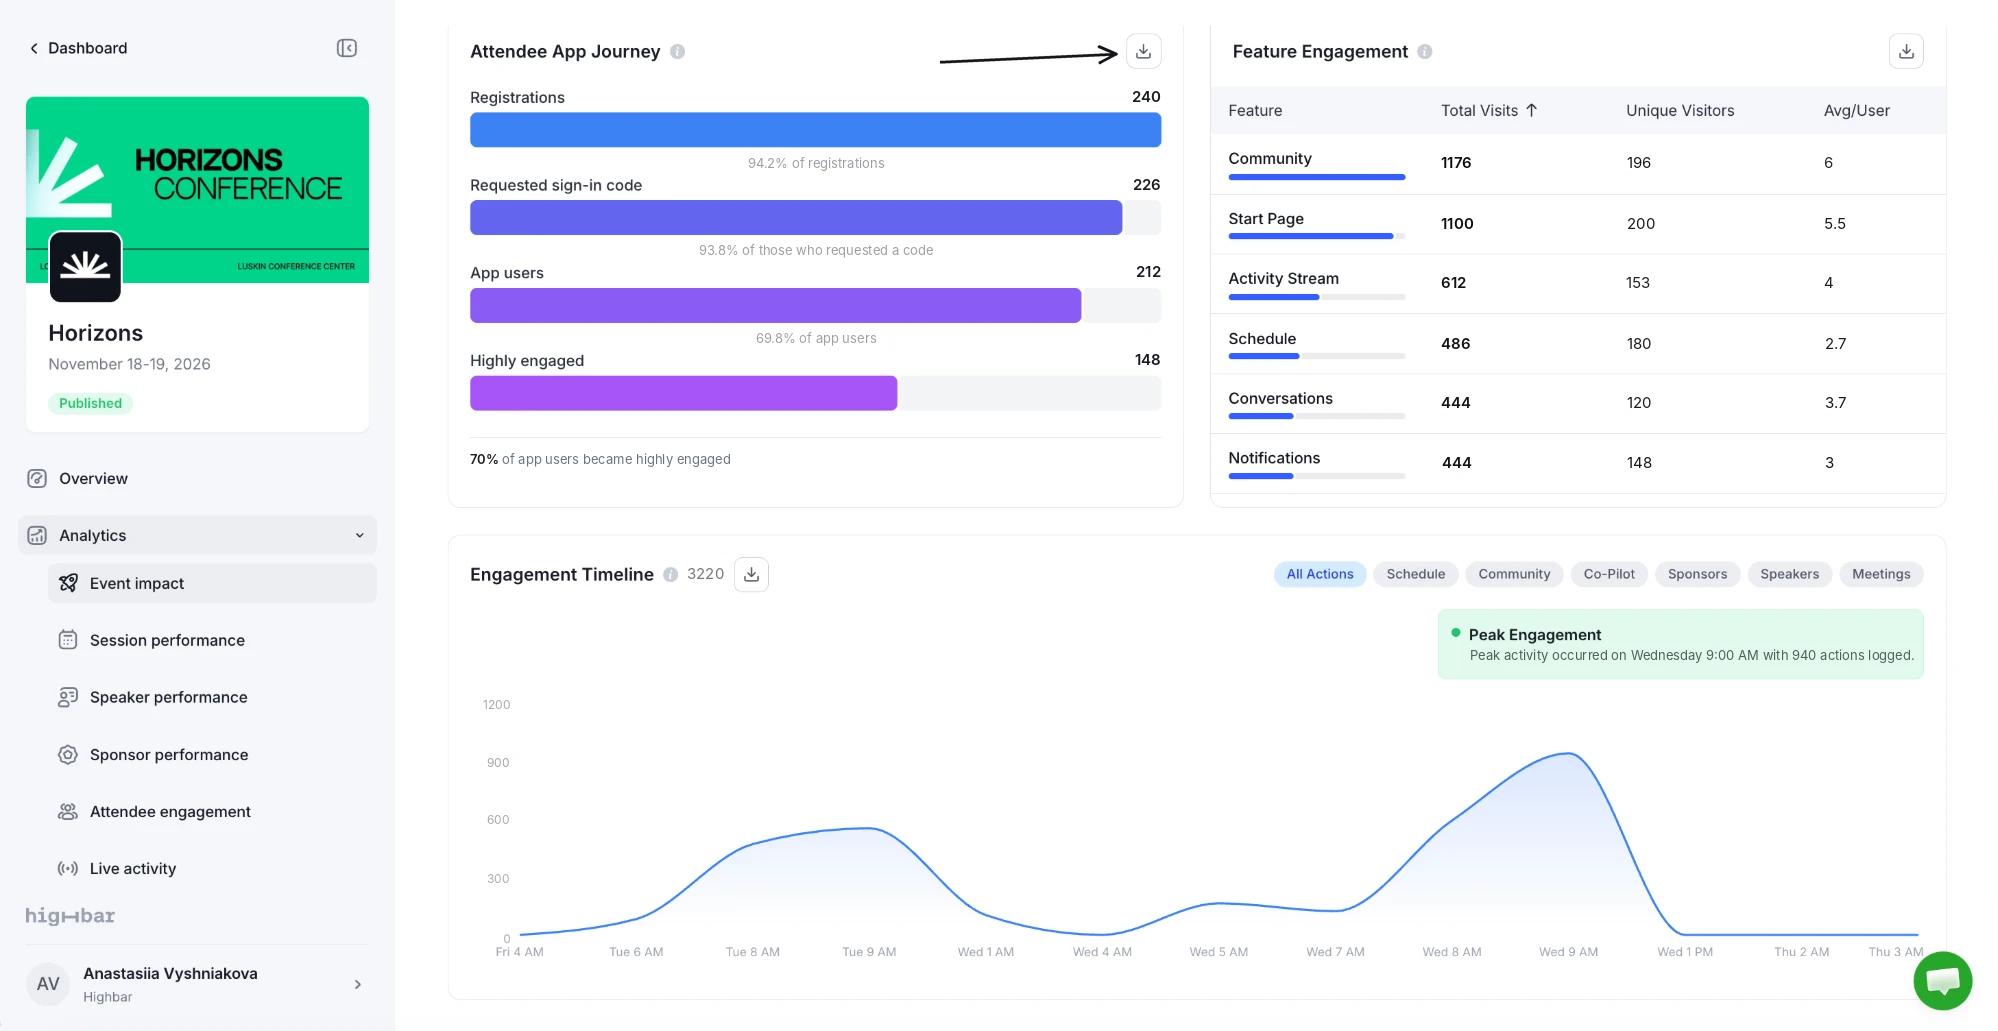
| Attendee App Journey | How many people moved from your list (Registrations) to Requested sign-in code, App users and Highly engaged, each as a share of the step before. |
| Feature Engagement | Visits to each part of the app, such as Schedule or Community, with unique visitors and visits per person. |
| Engagement Timeline | Actions per hour. Use the pills to show only Schedule, Community, Co-Pilot (AI Concierge), Sponsors, Speakers or Meetings activity. |
| Session Performance | Sessions ranked by views, with bookmarks and the share of attendees who opened them. Click Explore for Session performance. |
| Speaker Performance | Speakers ranked by profile views. Click Explore for Speaker performance. |
| Networking Funnel | How attendees used AI matching: goals added, matches viewed, messages sent and matches skipped. |
| Meeting Funnel | How attendees used 1:1 meetings: Request Clicks, Eligible Availability (times the person they picked could be asked to meet), Requests Sent and Accepted, with conversion rates below. |
| Search Analytics | What attendees searched for, and where. |
| Engaged Attendees | Your 50 most active attendees, with sessions viewed and total actions. |
| Sponsor Performance | Each sponsor's Impressions (profile views) and Engagements (clicks on their buttons, products, media and links, plus booth QR scans). Profile views aren't included, so these numbers are lower than Total Engagements on Sponsor performance, which counts them. |
| Platforms and Devices | Which systems (iOS, Android, Web) and devices attendees use. |
Some sections add a short insight, such as where most people drop off or when activity peaked. Sponsor Performance shows Boost Sponsor Visibility when fewer than half of your sponsors have had any interaction.
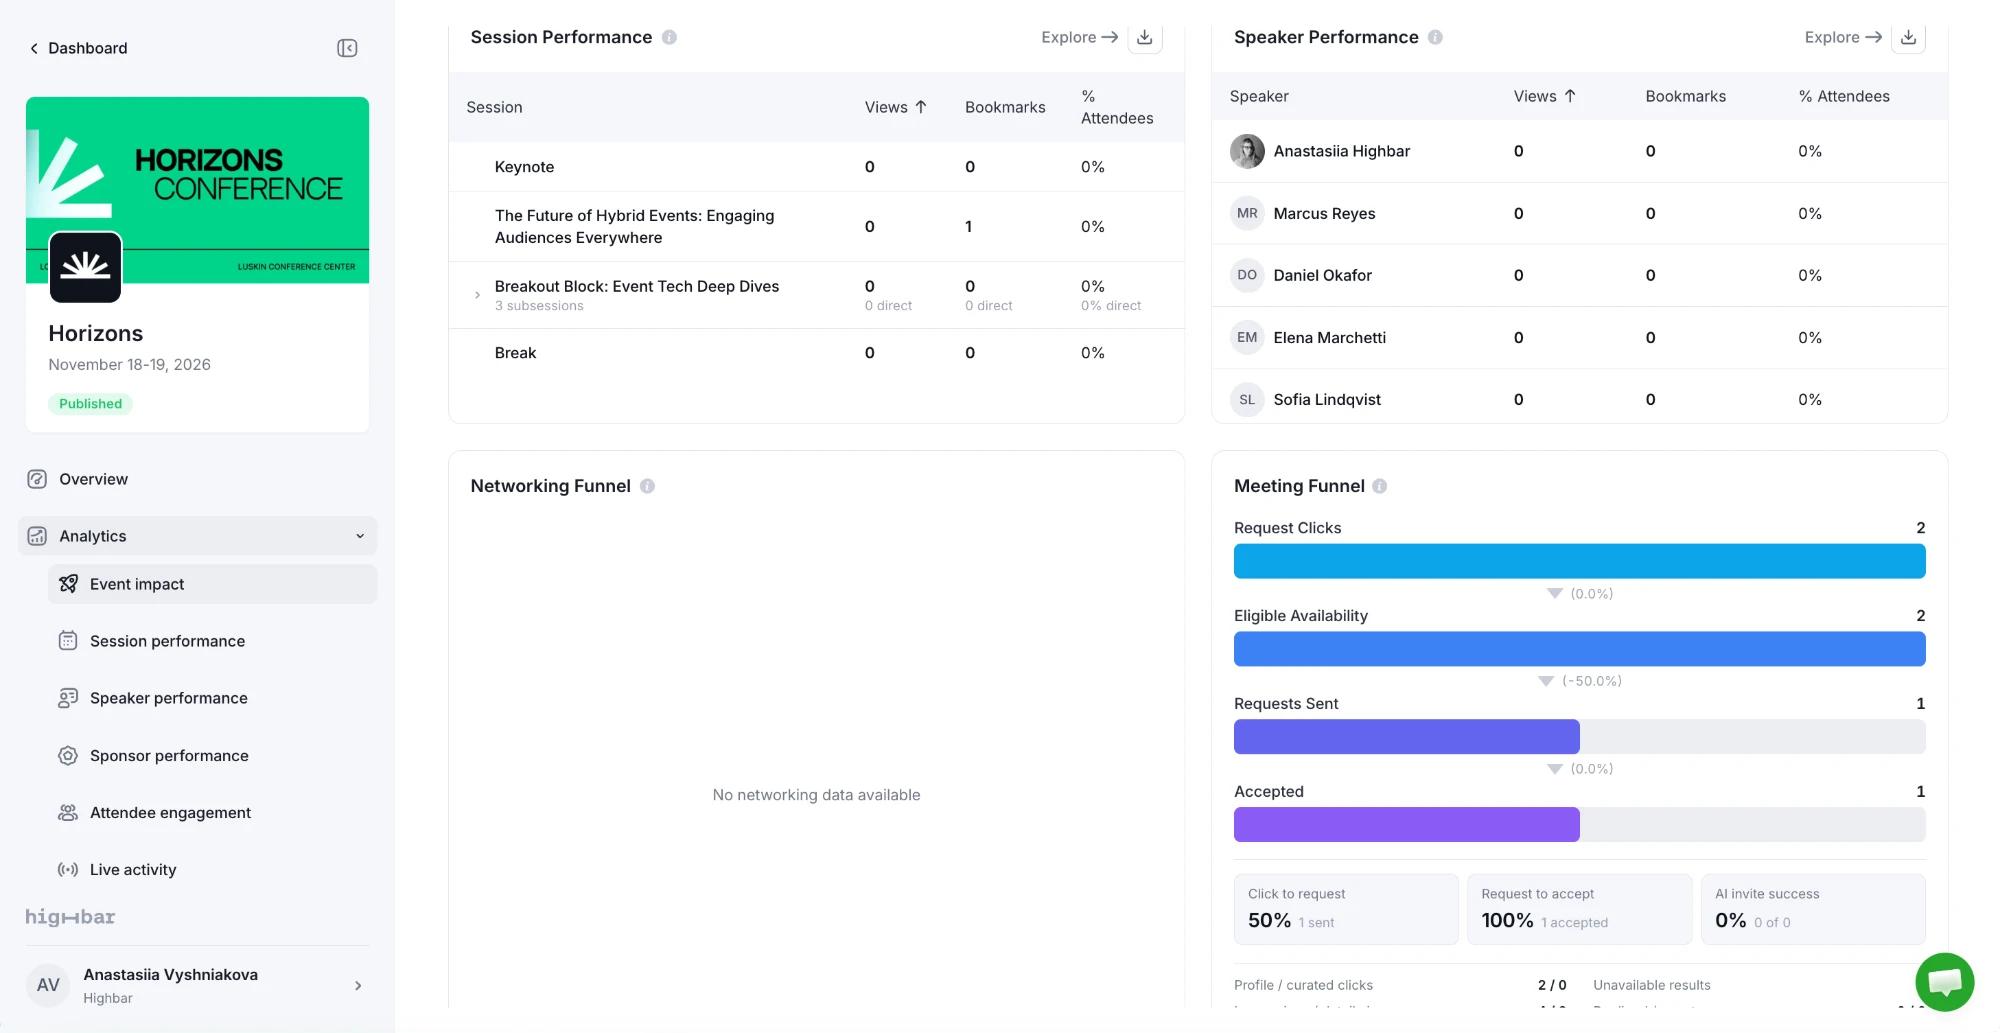
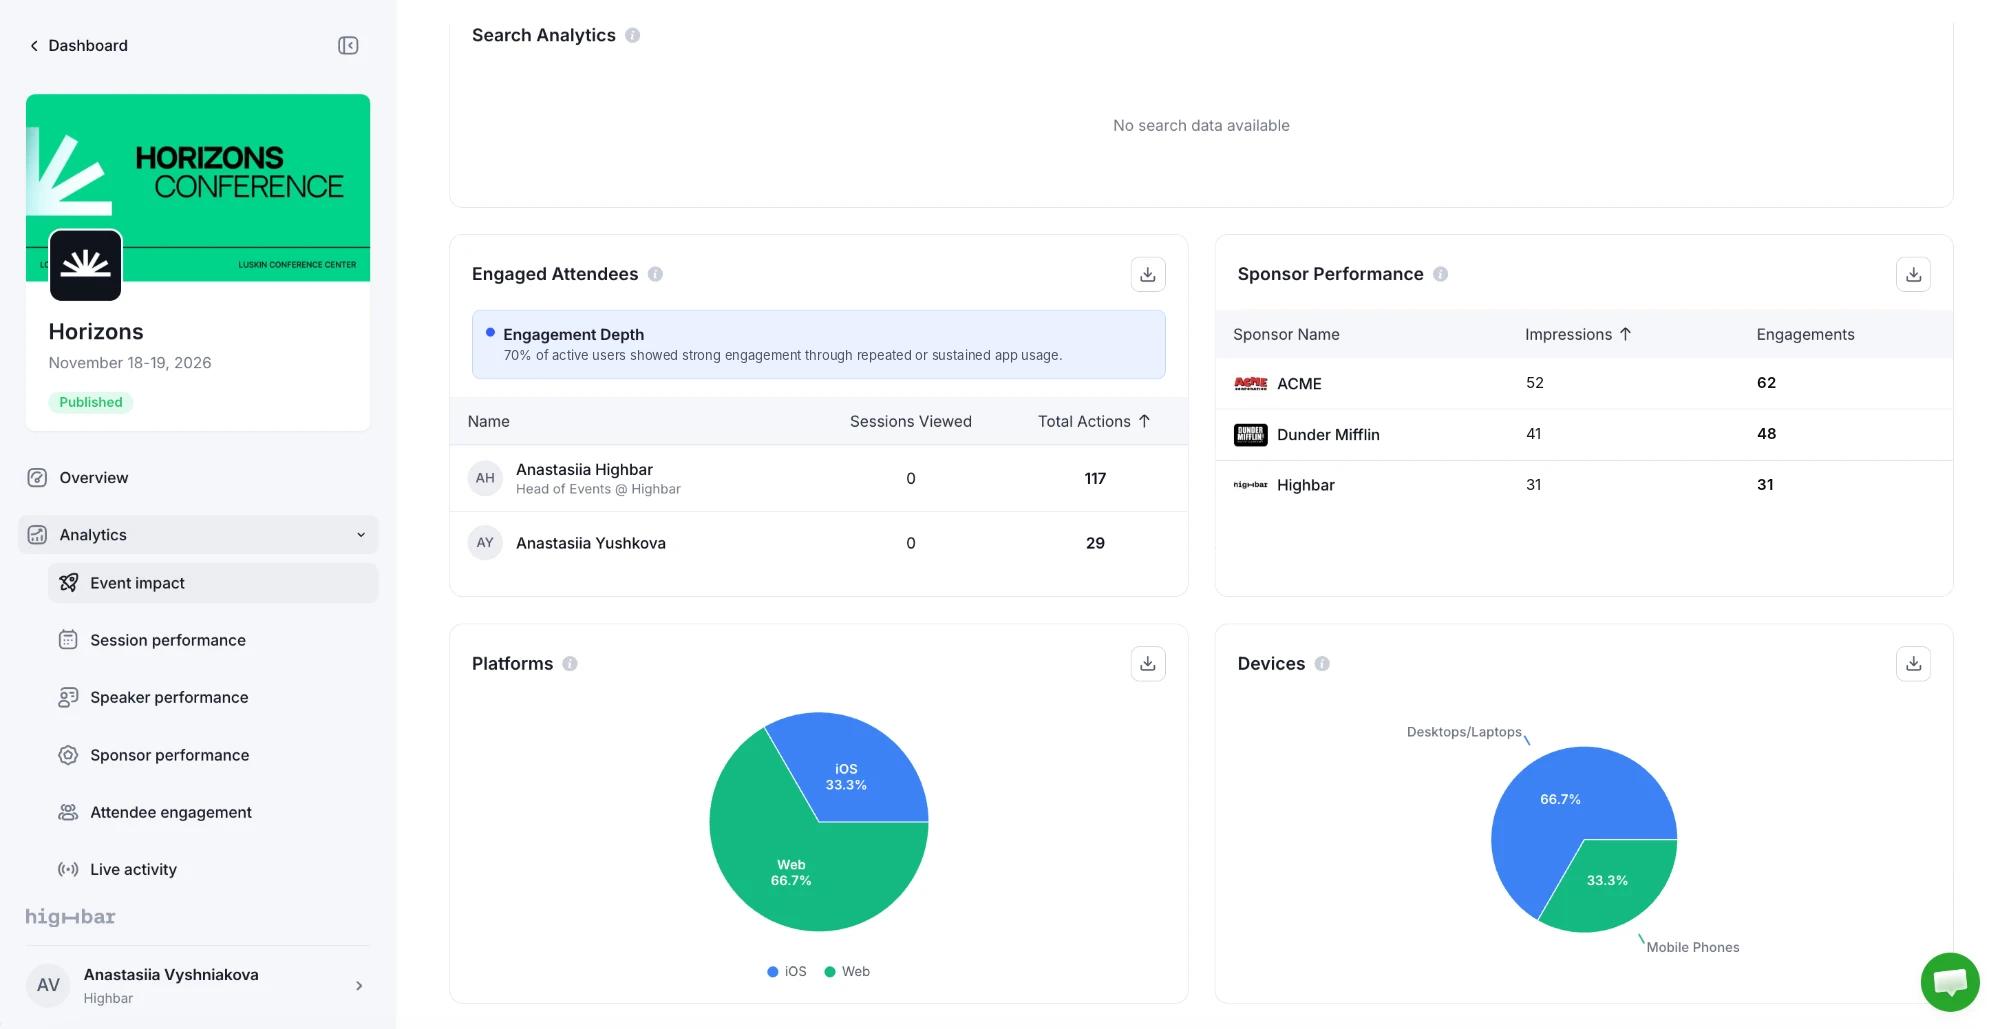
Click a session, speaker, attendee or sponsor in any table to see its activity in detail. A sponsor's details include Export sponsor report, a file you can send to that sponsor.
Export
Each section has its own download button for a CSV of that section.
To export everything at once, click Export analytics at the top right:
Choose a Format: Excel workbook (one file, one tab per section) or CSV files (one file per section, zipped).
Under Sections, tick what to include. All of them are ticked to start with; Clear all unticks them. The export goes further than the page: it can include every session and speaker rating, every engaged attendee, the full activity feed and every AI Concierge question.
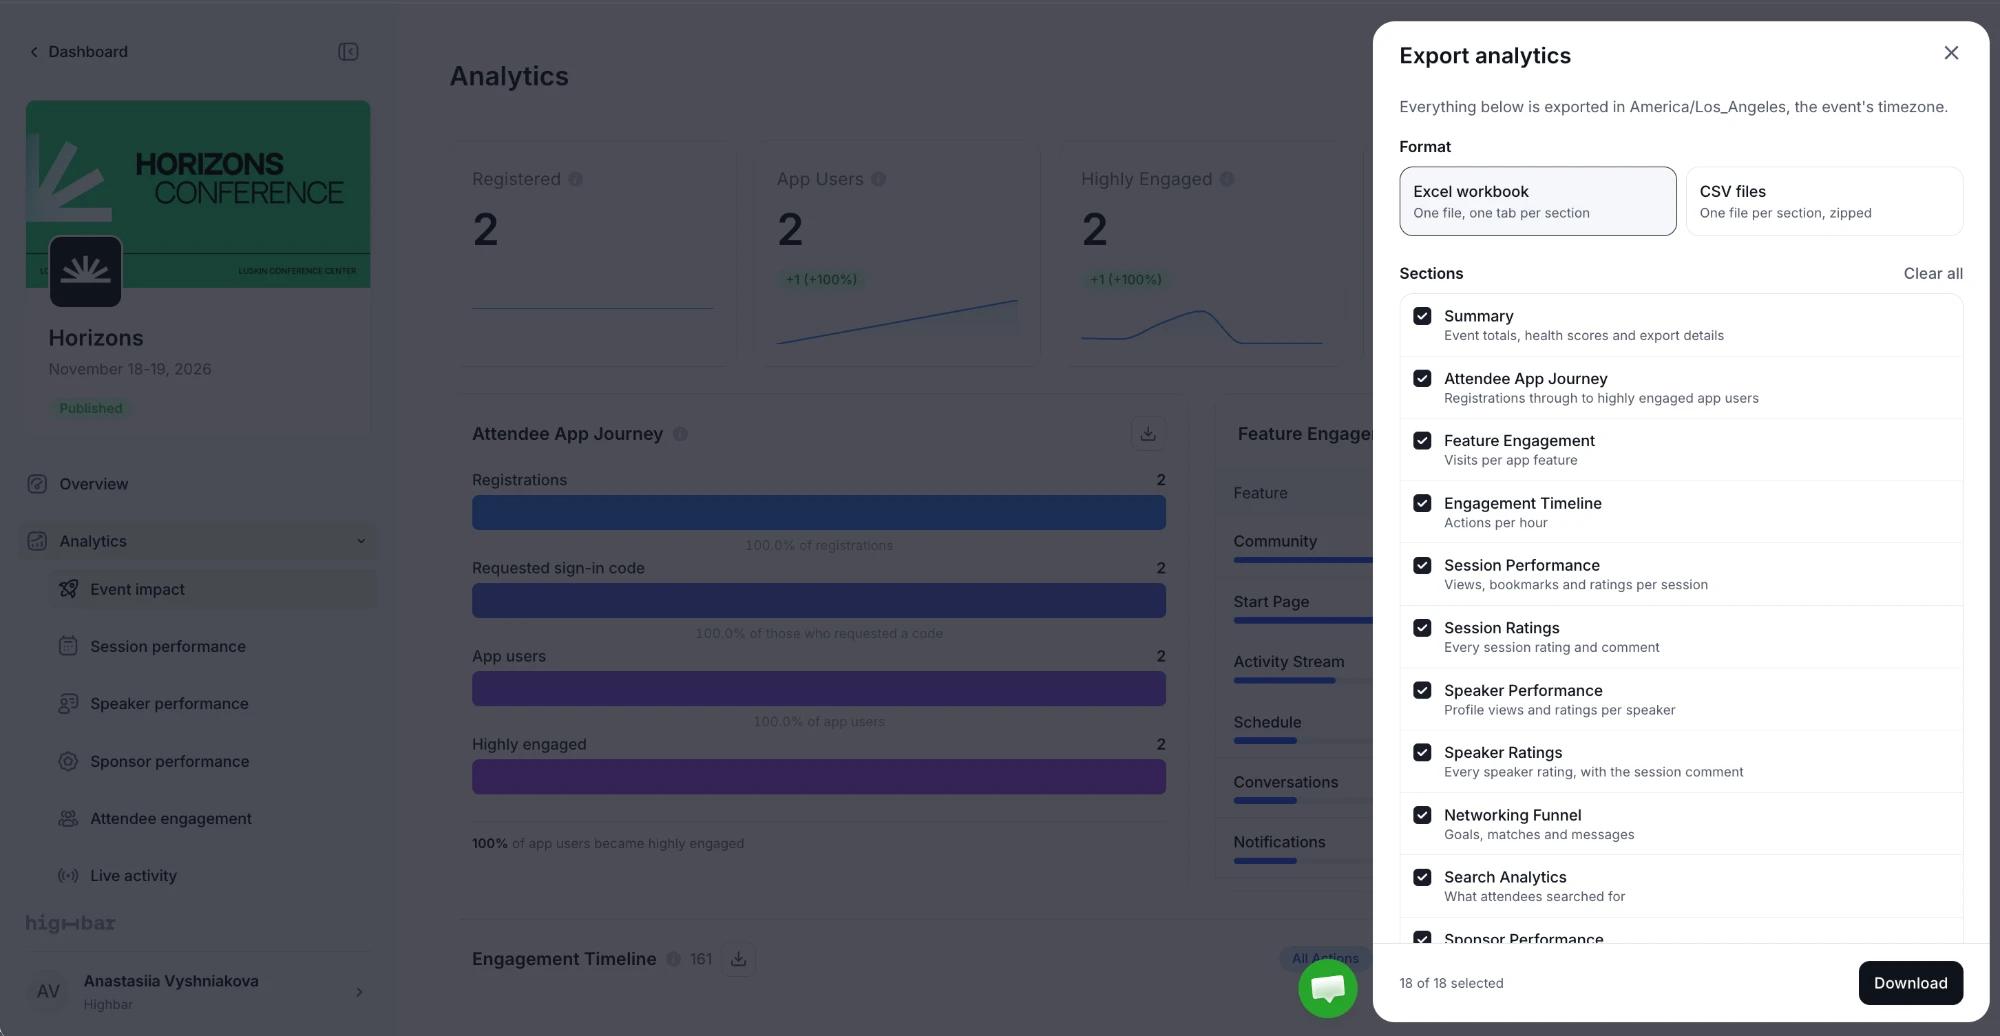
Click Download.
The Meeting Funnel isn't included in exports.